❮
❯
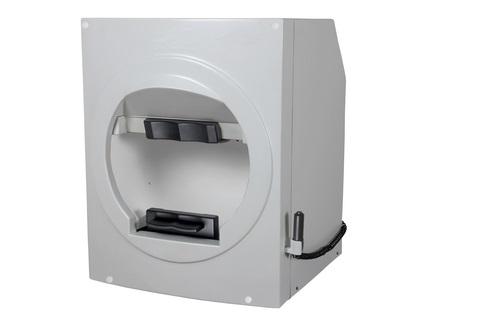
Product info
- Product name:projection perimeter
- Product code:CCE-T90
Packaging Specifications
- Outer Packaging Size:0.8 × 0.64 × 0.91 m
- Gross Weight:67 kg
- Net Weight:38 kg
- Volume:0.47
Description
Product Specifications
| Parameter | Details |
|---|---|
| Appearance | Split Type / Integrated Type |
| Stimulating Way | Optical Projection |
| Projection Surface | Aspheric Projection Arc |
| Detection Method | Static Perimetry, Dynamic Perimetry |
| Detection Scope | 0-90° |
| Brightness Level | 0-51db |
| Testing Distance | 300mm |
| Visual Target Color | Red, Blue, White (Model B: only White) |
| Visual Target Brightness | 0 – 10000 asb |
| Background Light | White (31.5asb), Yellow (315 asb) |
| Vision Target Interval Time, Keeping Time | System Adaption, Standard, Slow, Custom |
| Pupil Size Measurement | Auto |
| Head Movement Way | AEC Automatic Eye Position Monitoring and Correction System |
| Brightness Measurement | Intelligent Brightness Monitoring and Correction |
| Visual Target Size (Goldmann Standard) | I Grade, II Grade, III Grade, IV Grade, V Grade (Model B: only III Grade) |
| Detection Strategy | Full-threshold, Fast Threshold, Custom, Two Notation, Three Notation, Quantify Defects, Intelligent Dynamic, Fast Intelligent Dynamic |
| Threshold Policy | Age-related, Threshold-related, Single Intensity |
| Static Perimetry | Threshold Test Mode: Center 10-2, Center 24-2, Center 24-2C, Center 30-2, Center60-4, Nasal Step, MaculaScreening/Special Test Mode: Center 40, Center 64, Center 76; Center80, Center Armaly, Peripheral 60, Nasal Step, Armaly Full Field, Full Field 81, Full Field 120, Full Field 35, Full Field246, Upper36, Upper 64, Esterman Monocular, Esterman Binocular |
| Dynamic Perimetry | Dynamic Program: Manual Procedures, Standard Procedures (Standard 45, Standard 30, A Standard 15), Single Point Map, Dark Spot Map, Blind Spot Map, Custom Scan, Custom Dynamic ProgramStimulation Parameters: Adjustable (Speed 1-9 / S, Visual Target Size, Color, Intensity, Test Ranges, Etc.) |
| Fixation Monitoring | Dynamic Real-time Video Monitoring, Physiological Blind Spot Monitoring, Eye Tracking Curve, Eye Position Offset Alarm |
| Analysis Software | Reliability Analysis, Single Vision Analysis, Triple Report Analyzes, Overview Vision Analysis, GHT Glaucoma Hemifield Test, GPA Glaucoma Progression Analysis |
| Report Chart | Numerical Map, Gray Scale Map, Total Deviation Chart, Total Deviation Probability Map, Pattern Deviation Chart, Pattern Deviation Probability Map, Fixation Map |
no comments